


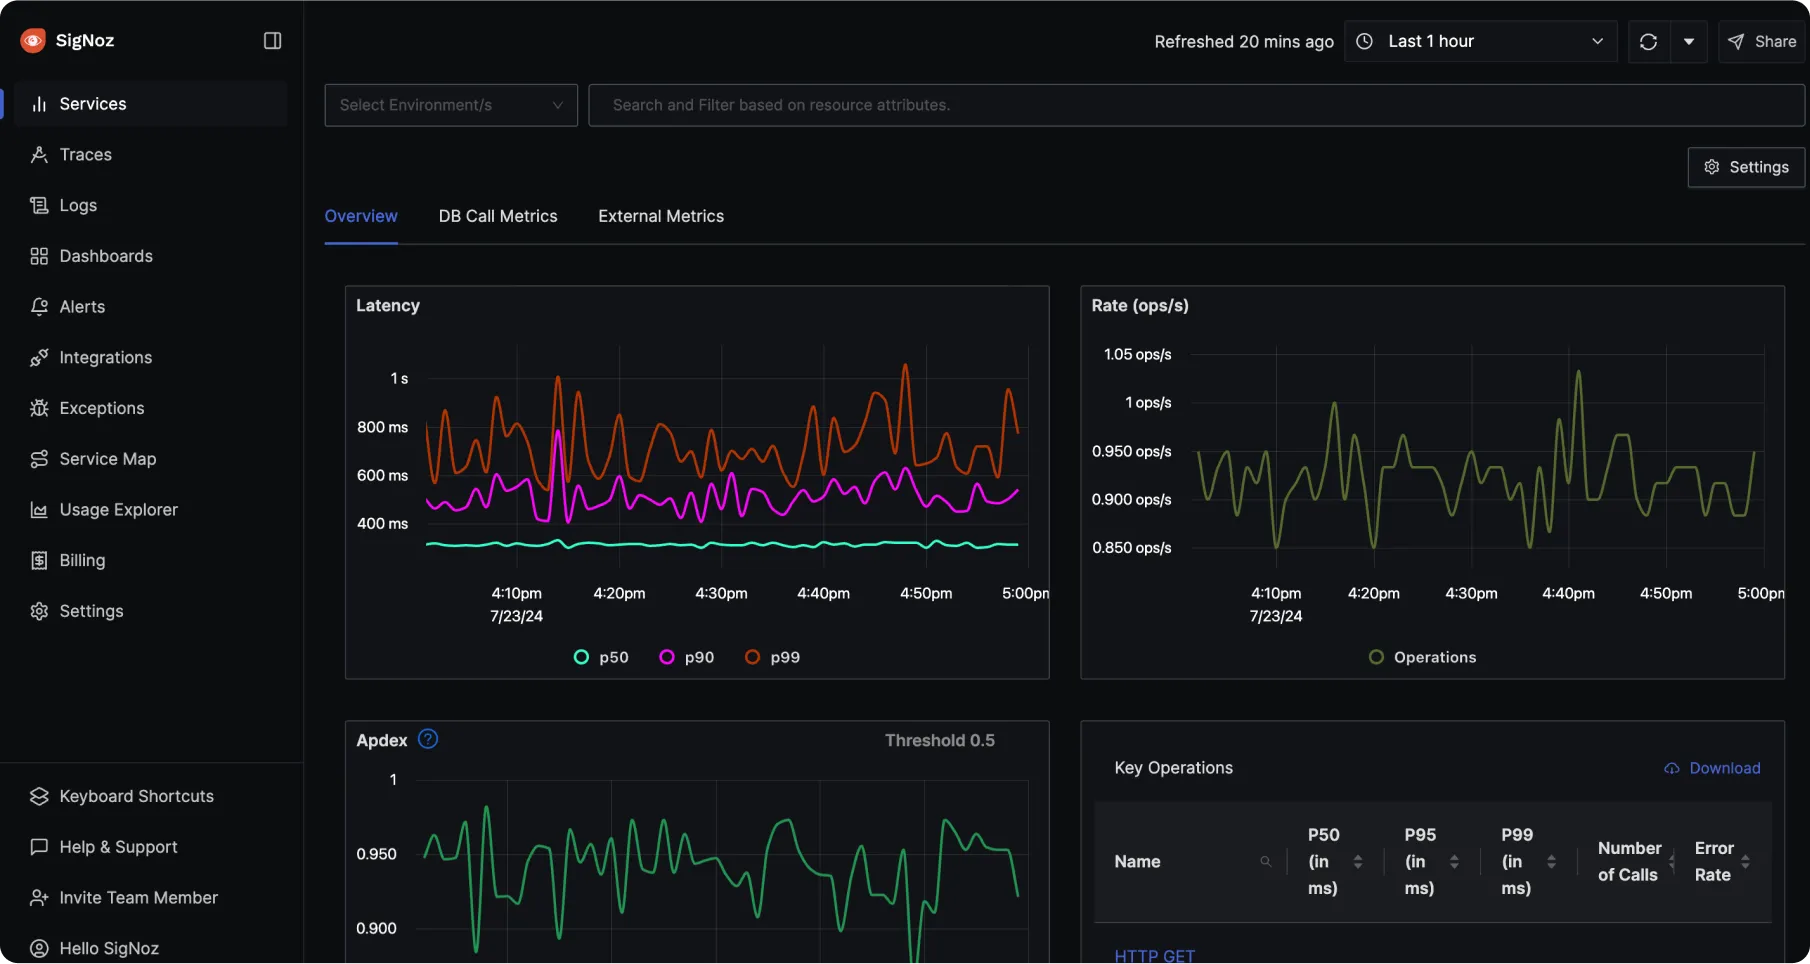
If you've ever set up Prometheus + Grafana + Loki + Tempo separately and tried to make them talk to each other — you know the pain. SigNoz solves exactly this. It's a single platform built on OpenTelemetry and ClickHouse that gives you metrics, distributed traces, and logs out of the box.
This pack walks you through a complete self-hosted setup using Docker Compose. By the end you'll have a running observability stack you can point your applications at immediately.
What's in this Pack
- SigNoz backend (query service + UI)
- ClickHouse (columnar database for telemetry storage)
- OpenTelemetry Collector (receives traces, metrics, logs from your apps)
- ZooKeeper (ClickHouse coordination)
- Alert manager built-in
Where to run it
SigNoz needs a real server with at least 4 GB RAM — it won't run on a $5 VPS. For self-hosted setups I recommend DigitalOcean. The $24/month Droplet (2 vCPU / 4 GB RAM) is the minimum viable option. The $48/month one (2 vCPU / 8 GB) is more comfortable if you're running multiple services.
If you sign up via this link you get $200 in free credit for 60 days — enough to run SigNoz for free while you evaluate it.
A Ubuntu 22.04 or 24.04 Droplet is the recommended starting point. DigitalOcean also has a one-click Docker image if you want to skip the Docker installation step.
Requirements
- RAM: minimum 4 GB — SigNoz will not run reliably with less
- CPU: 2+ cores
- Disk: 20+ GB for data retention
- OS: Linux or macOS (Windows not officially supported)
- Docker Engine 20.10+ and Docker Compose v2.0+
- Git
- Ports open: 8080 (UI), 4317 (OTLP gRPC), 4318 (OTLP HTTP)
Step 1: Clone and start SigNoz
SigNoz ships with its own Docker Compose setup. You don't need to write one from scratch:
# Clone the repo
git clone -b main https://github.com/SigNoz/signoz.git
cd signoz/deploy/docker

# Start the stack
docker compose up -d --remove-orphans
First startup takes a few minutes — ClickHouse runs schema migrations on boot. Monitor it with:
docker compose logs -f signoz-clickhouseOnce ClickHouse is healthy, open http://localhost:8080 in your browser. You'll be prompted to create an admin account on first login.
Step 2: Verify everything is running
docker compose psYou should see these containers in running or healthy state:
signoz-signoz— the main backend + UIsignoz-clickhouse— the data storesignoz-otel-collector— telemetry ingestionsignoz-zookeeper-1— ClickHouse coordinationsignoz-schema-migrator-sync— exits cleanly after migrations
If any container is restarting, check its logs:
docker compose logs -f signoz-signozStep 3: Send your first telemetry
SigNoz uses the OpenTelemetry protocol (OTLP). Your application needs an OpenTelemetry SDK to send data. Here's a quick test using the telemetrygen tool:
# Install telemetrygen (Go required)
go install github.com/open-telemetry/opentelemetry-collector-contrib/cmd/telemetrygen@latest

# Send test traces
telemetrygen traces --otlp-insecure --duration 5s

# Send test metrics
telemetrygen metrics --otlp-insecure --duration 5s
Or if you want to send a quick test without installing Go, use curl to hit the OTLP HTTP endpoint:
curl -X POST http://localhost:4318/v1/traces \
  -H "Content-Type: application/json" \
  -d '{"resourceSpans":[]}'
A 200 response confirms SigNoz is accepting telemetry.
Step 4: Instrument your application
Point your OpenTelemetry SDK at SigNoz. The OTLP endpoint is the same regardless of language:
# gRPC (recommended)
OTLP endpoint: localhost:4317

# HTTP
OTLP endpoint: http://localhost:4318
Example environment variables for a containerized app in the same Docker network:
OTEL_EXPORTER_OTLP_ENDPOINT=http://signoz-otel-collector:4318
OTEL_SERVICE_NAME=my-service
OTEL_RESOURCE_ATTRIBUTES=deployment.environment=production
For apps on the same host (not in Docker):
OTEL_EXPORTER_OTLP_ENDPOINT=http://localhost:4318
OTEL_SERVICE_NAME=my-service
Step 5: Set up alerts
SigNoz has a built-in alert manager. Go to Alerts → New Alert in the UI and set up your first alert. The most useful ones to start with:
- Error rate — alert when HTTP 5xx errors exceed 1% of traffic
- P99 latency — alert when the 99th percentile response time exceeds your SLA
- Service down — alert when a service stops sending traces for 5+ minutes
You can route alerts to Slack, PagerDuty, or email via the notification channels in Settings.
Step 6: Retention and data management
By default SigNoz retains data for 15 days. Change this in Settings → General → Retention Period. For a dev/staging server 7 days is usually enough. For production, 30–90 days depending on your storage budget.
To back up your telemetry data:
# Stop first for a consistent snapshot
docker compose down

# Back up ClickHouse volume
sudo tar -czvf signoz-backup-$(date +%Y%m%d).tar.gz \
  /var/lib/docker/volumes/docker_signoz-clickhouse-data

# Start again
docker compose up -d
Step 7: Keeping SigNoz updated
cd signoz/deploy/docker
git pull origin main
docker compose pull
docker compose up -d --remove-orphans
Troubleshooting
- UI not loading — ClickHouse takes 2–5 minutes on first boot. Wait and retry.
- Containers restarting — almost always insufficient RAM. Check
free -hand make sure you have 4+ GB available. - No data appearing — verify your app is sending to the correct endpoint and that ports 4317/4318 are reachable from the app container.
- Port conflicts — if something is already using port 8080, edit the
docker-compose.yamlto change the host port mapping.
SigNoz vs Prometheus + Grafana
The honest comparison:
- SigNoz wins on setup simplicity — one stack vs assembling 4–5 separate tools
- SigNoz wins on traces — distributed tracing is a first-class citizen, not an afterthought
- Prometheus wins on maturity and ecosystem — more exporters, more community resources
- Grafana wins on dashboard flexibility — more visualization options, more data source support
If you're starting fresh and want traces + metrics + logs without gluing things together — SigNoz is the faster path. If you already have a Prometheus setup and it's working — don't migrate just for the sake of it.
Member discussion